What is UML?
The Unified Modeling Language (UML) is made up of integrated diagrams used by IT developers for the visual representation of objects, states and processes within a software or system. The modeling language can serve as a blueprint for a project and guarantee a structured information architecture; and also can help developers present their description of a system in a comprehensible way for external specialists. UML is mainly used in object-oriented software development. Enhancements to the standard in version 2.0 also make it suitable for representing business processes.
Unified Modeling Language’s development
Even before UML was introduced to software development, the field of object-oriented programming (OOP) was already growing. This programming style is based on the concept that everything is an object: the building blocks of a program are objects that interact with each other. The messages sent back and forth also consists of objects. Each individual object is an example of its superordinate class. The class itself also acts as an object, and determines the behavior of the object instances it contains. Objects consist of data and code. The object arranges the data in fields, also called attributes. The code determines their procedure or method.
From the late 1980s to the 1990s, many methods and languages for the representation of OOP were developed and put into use. The result was a variety of methods that were largely dissimilar. To unify these, the three developers James Rumbaugh, Grady Booch and Ivar Jacobson decided to merge several existing languages into a common, standardized one.
The three had already created their own object-oriented software development methods:
- The Booch method
- The object modeling technique (OMT)
- The object-oriented software engineering method (OOSE)
UML should define the semantics for the representation of these methods as the modeling language. Under the name “UML Partners”, the developers started working on the completion of UML in a team in 1996. They then handed it over to the Object Management Group (OMG), who introduced the unified modeling language version 1.1 as the standard in 1997.
Not satisfied, the developers set up a task force to improve the language over several versions. Existing criticisms included imprecise, unnecessarily complex semantics, a lack of adaptability, and fairly poor standardization. For this reason, a major revision was carried out. The result was UML 2.0, which set the new standard in 2005. Version 2.4.1 forms the basis for the ISO standardization 19505-1 (Infrastructure) and 19505-2 (Superstructure) of 2012. UML Version 2.5.1 appeared in December 2017.
UML: Key terms
Some call “unified modeling language” the lingua franca among the modeling languages, which is really what it aimed to become. As mentioned above, UML visualizes the states of objects and interactions between them within a system. Its widespread use may be due to the great influence of object management group (OMG) members (including IBM, Microsoft and HP). Structured semantics also contributes to this. UML diagrams show the following system components:
- Individual objects (basic components)
- Classes (combination of elements with the same properties)
- Relationships between objects (hierarchy and behavior/communication between objects)
- Activity (complex combination of actions/behavioral building blocks)
- Interactions between objects and interfaces
Metamodeling
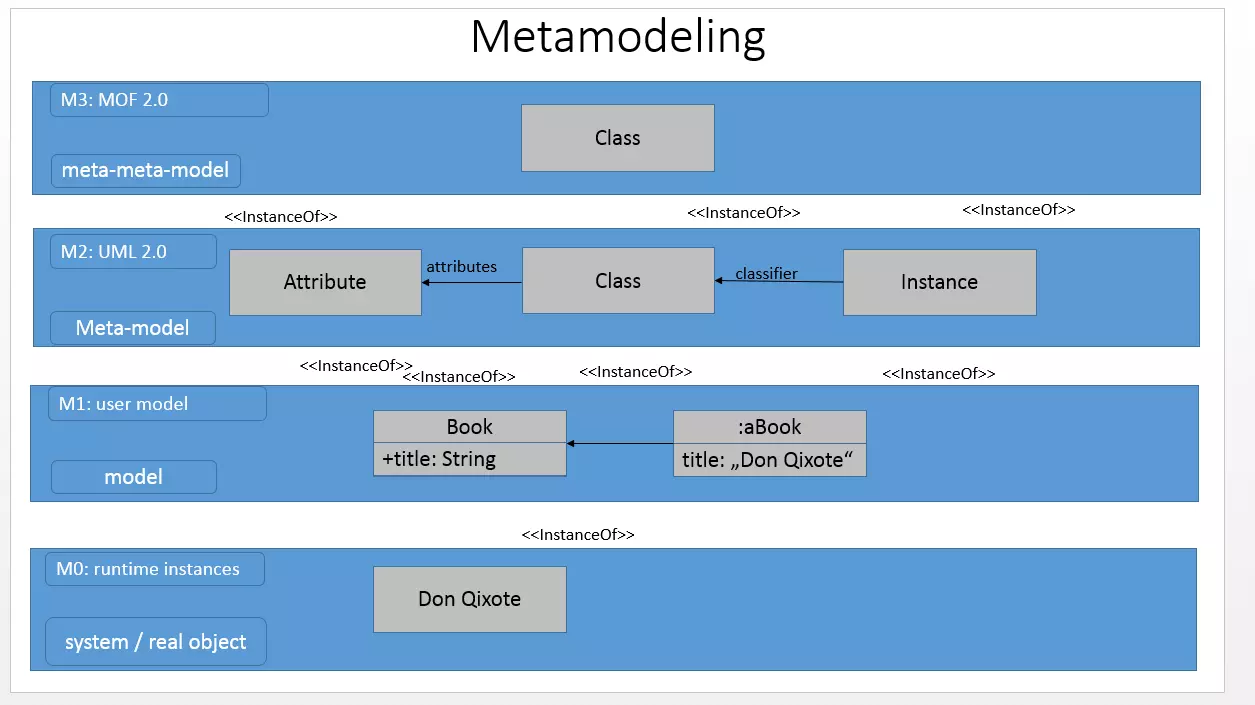
UML 2.0 defines language units that operate on different levels. You use these to express the structure and behavior of a system. Meta-modelling includes all elements of UML, including those that describe UML itself. It uses four hierarchically arranged levels (M0 to M3).
The meta-meta level M3 specifies the metadata of the modeling language and its relationships using the metaobject facility (MOF). It defines the meta-model, and also enables metadata transfer. The XMI format defined by the object management group members is a practical tool for sharing object-oriented data at the meta-meta level between development tools. The object constraint language (OCL), a declarative programming language, supplements UML and regulates the modeling’s boundary conditions. As a text language, however, it’s only supportive and can’t be used for modeling.
The image shows that the metamodeling of UML 2.0, level M0 is the basic level. It represents concrete, real objects and individual data records - e.g. an object or a component. Level M1 comprises all models that describe and structure the data of level M0. These are UML diagrams such as the activity diagram or the package diagram (explained below). To define the structure of these models, M2 meta-models define the specifications and semantics of the model elements.
If you want to create an understandable UML diagram, you need to know the UML meta-model and its rules. The highest level, M3, is a meta-model of the meta-model. The mentioned meta-object facility works on an abstract level that defines meta-models. This level defines itself, since otherwise further, superordinate meta-levels would arise.
Language Units
UML (layer M2) defines the rules for its own semantics. The language units are terms defined in UML 2.0 superstructure. This means a formal representation that everyone involved can understand is possible. Language units abstract similarly structured and similarly functioning objects and processes, and give them a visually representable form. Depending on the hierarchy level within the model, elements take on more specialized tasks or define other elements more closely.
Class: As a language unit, classes are a core aspect of UML. You define what a class is and how classes interact with each other. This language unit has four levels, ranging from simple elements to more complex relationships:
- Core (describes elements from the UML 2.0 infrastructure such as package, namespace, attribute, etc.)
- Association classes
- Interfaces
- Powertypes (classes whose instances are subclasses within this class)
Components: Components are software modules that separate their contents from the external system. There is only a connection to the outside through interfaces or port. A composition connector establishes a connection to another component via the interface. The delegation connector links internal elements with an interface at the external border. Components are modular and interchangeable.
Composite structure: The composite structure of language units describes elements that are shielded inwards and outwards like components. Only ports connect the content to the external system. The so-called encapsulated classifiers are composed of elements called parts. Parts communicate via connectors.
Profile: A profile configures UML 2.0 for specific needs. Abstract terms such as activity or object must be specified for some projects to increase understanding. You can use a profile to adjust semantics and notations that are loosely set.
Model: The model includes all elements necessary to represent a specific view of the structure or behavior of a system. This also includes external influences such as actors.
Action: When it comes to depicting behavior, actions are central. They represent a single step within an activity – an activity, in turn, is a behavior which is made up of a collection of actions. Here are some examples of actions:
- Fill order
- Show error page
- Process order
Behavior: The language unit “behavior” or “behavior description” means the modeling of dynamic aspects within a system. It contains three specifications:
- Activity: Actions interact through data and control flows. This results in a complex system of behaviors - the activities.
- Interaction: This meta-model describes how message flows are exchanged between objects, when a message is sent and to which object, and which other elements are affected by it.
- State machines: In a state diagram, this meta-model shows states (situations with unchangeable properties) and pseudo-states (states without value assignment) along with their transitions. Objects in a state can be assigned to actions or activities.
Distribution: A network consists of objects that are connected to each other in meshes. A special case of application exists if these elements represent executable software or artifacts. These artifacts run on execution environments or devices that UML 2.0 categorizes as nodes. The artifact is therefore dependent on the node. The distribution represents this dependency relationship that arises during installation.
Application case: The application case (as a language unit) represents system requirements. The actor (a person or a system) is an element that determines who or what is to perform a particular activity through the system. The system can also be a class or component, and is therefore described as a subject. The use case (as a model element) only informs that a named behavior is expected that is visible to the outside world. It does not usually show the exact actions. Within a behavioral description, modeling assigns the detailed requirements to the application case.
Information flow: This UML language unit describes the elements information unit and information flow. These model elements define techniques for describing behavior that can be very detail-oriented, such as activities or interactions. This simplified representation allows the universal use of these modeling elements in all UML diagram types.
UML diagrams: their usage and a short general introduction
The modeling language defines 14 diagram types, which are divided into two categories. The main categories “structure” and “behavior” represent the basic concepts represented by UML diagrams. Within the group of behavioral diagrams, UML specifies the subcategory “interaction diagrams”. A fourth sub-specification has existed since UML 2.0 was developed, and defines the design of the model diagrams.
Structure Diagrams
Structure diagrams represent the individual elements in a system. Therefore, they are particularly suitable for representing software architecture. The static representation does not represent a change, but rather represents states and dependencies at a certain point in time. The individual elements, or objects, are related to each other. For example, an object belongs to a class. Other components are computer nodes or artifacts - an artifact represents a result, for example a finished script file.
UML diagrams of this category represent an entire system or a substructure. The latter helps, for example, to clarify the structure in detail. The language of the “structure” category assigns seven UML diagram types in UML 2.0:
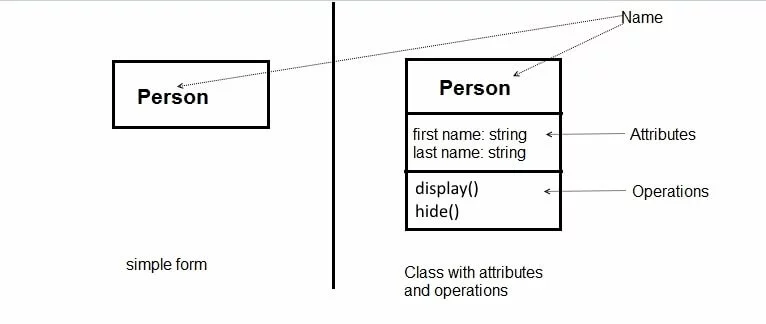
- Class diagram: If objects have a common behavior or the same structure, you can classify them or assign them to a class. The class is therefore a simplifying, summarizing element (abstraction) for visual representation. Classes and objects are linked to each other using interfaces. All these components and their relationships to each other can be represented in a class diagram. A class represents its diagrams using a rectangle. The name of the class is in bold type, as shown below.
- Object diagram: An object diagram has a similar structure to a class diagram. Instead of the name as it appears in the class diagram (see “person” above), the object diagram puts the name along with the classifier/category name. According to the specification, this is underlined (e.g.: Helga:Person)
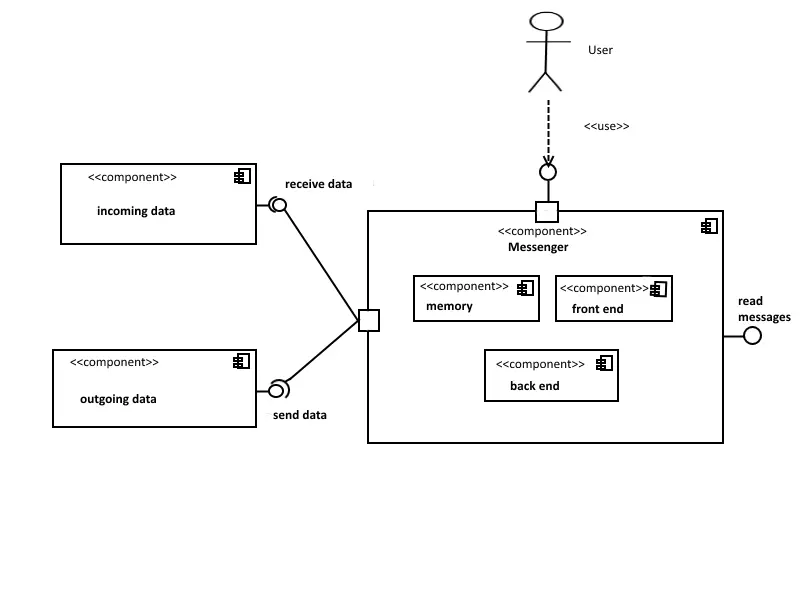
- Component diagram: A component is a module that is isolated from the external system and interacts with other components via defined interfaces. It's a subtype of the class. Therefore, structural characteristics such as operations and attributes define the component more clearly. There are two display options for modeling, depending on requirements: the black box view (content is hidden) and the white box view (content is visible).
- Composite structure diagram: Objects belong to classes, which in turn can also be classified. These so-called meta-classes are called classifiers in UML. The composite structure diagram represents the individual parts and connectors of a classifier. Parts are always part of the whole, even if they are not necessarily needed to complete the classifier. Connectors are the links between parts. Features or services that require components outside the classifier send parts via an interface.
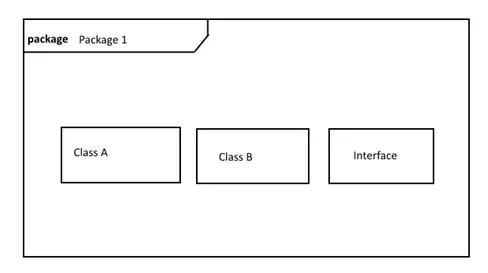
- Package diagram: A package combines elements such as interfaces or classes in a namespace (see note below diagram). Packages can also merge with other packages (package merge), import them (package import), or contain other packages (sub-packages). Package structure diagrams link contents hierarchically, like in a tree diagram. The package diagram is used, for example, in the meta-model of UML 2, and is modular in software systems. Strictly specified, a package consists of a head and a content area.
A namespace is an element of the UML-2 meta-model. Components must have a name, and one of the following visibility attributes: package, private, protected or public. The package is a special case of the namespace.
- Deployment Diagram: A deployment diagram models the physical distribution of artifacts on nodes. Nodes are either hardware (device nodes) that can provide memory, or software (execution environment nodes) that provides an environment for executing processes. They are represented as three-dimensional cuboids. These contain the file name. To distinguish them from a class, the cuboids have stereotypes such as <<artifact>>. The diagram is suitable for displaying dependencies between nodes and artifacts, so-called distribution relationships.
</artifact> - Profile diagram: Profile diagrams are used at the meta-model level. They are used to assign a stereotype to classes, or a profile to packages. On the meta-level, it is possible to adapt the model for another platform or domain. For example, if you restrict the UML semantics within a profile, it passes on the specifications to the subordinate classes.
Behavior Diagrams
Behavior diagrams cover the remaining specifications under UML. Unlike structure diagrams, they aren’t static, but represent processes. Behavior diagrams also include interaction diagrams (see below).
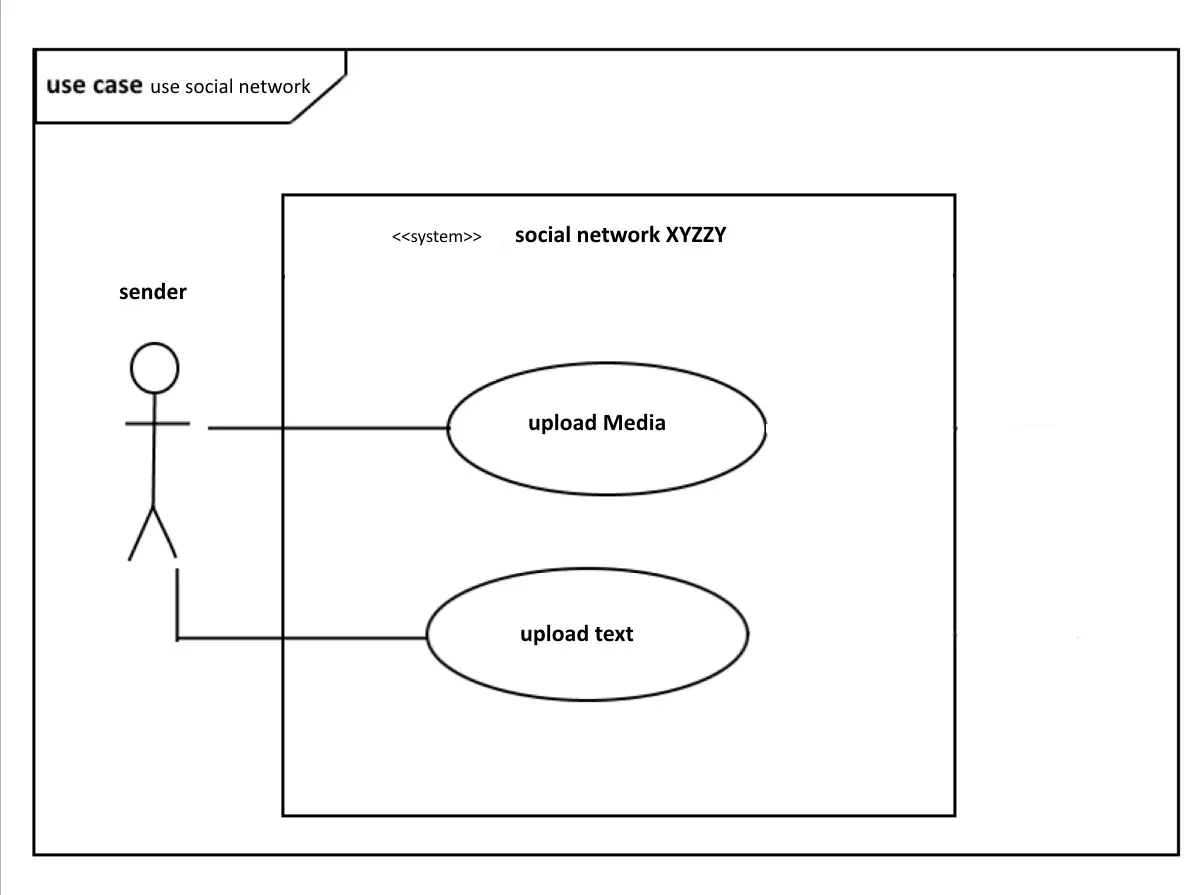
- Use case diagram: Use case diagrams show which behavior is expected from a system later. This modeling is not only suitable for software systems, but also to predict procedures in business, for example. The use case involves an actor (human or system) with a goal. The diagram usually has the target as its name. The different use cases within the system fulfill the actor’s objective.
The use case diagram represents UML using a rectangle labelled “use case”. The sender is the actor (this is represented as a stick figure, even if it is a system – see below). The actor is connected to the application case (ellipse with label) within a system (rectangle with label <<system>>, and name of the system).
- Activity diagram: Activities consist of a network of actions that are linked by data and control flows. While the use case diagram shows system requirements, the activity diagram shows how these use cases run. In this type of diagram, tokens play a role. In parallel processes, they are a marker for which processes are prioritized, and receive resources (for example, working memory).
- State machine diagram: A state machine, also called finite automaton, represents a finite set of states in a system. If a fixed condition is fulfilled in the system (i.e. a trigger goes off), a corresponding reaction happens. This may include activities or interactions. Under UML 2.0, a state represents this situation. States are regarded as vertices, and are displayed as rectangles with rounded corners. In addition, the state machine diagram models transitions from one state (source node), to the other (target node).
Interaction diagrams
Interaction diagrams are a subtype of behavioral diagrams. They also depict processes. They are particularly suitable for modeling behavior in which elements exchange information. The diagrams define the role of the objects involved. They also name and prioritize the messages that are sent back and forth between the objects. Interaction diagrams also show how these messages affect behavioral elements, such as starting or stopping activities:
- Sequence diagrams: As an interaction diagram, the sequence diagram represents the exchange of messages between objects. The UML diagram type models these objects as a so-called lifeline. In this sense, it is similar to other behavioral diagrams such as the activity diagram. In contrast to these, however, a sequence diagram is not used to obtain a broad overview of the behavior of a system, but to present in detail one possible behavior among many. It prescribes a chronology, and a dashed line represents the course of time.
UML 2.0 displays synchronous messages (an arrow with filled-in head), and asynchronous messages (an arrow with open head). Synchronous messages are messages that block a channel until they receive a response from the target object. They determine behavioral characteristics in the form of synchronous operations. Asynchronous messages control the calling source object. These include both asynchronous operations and signals (data packets sent between actions).
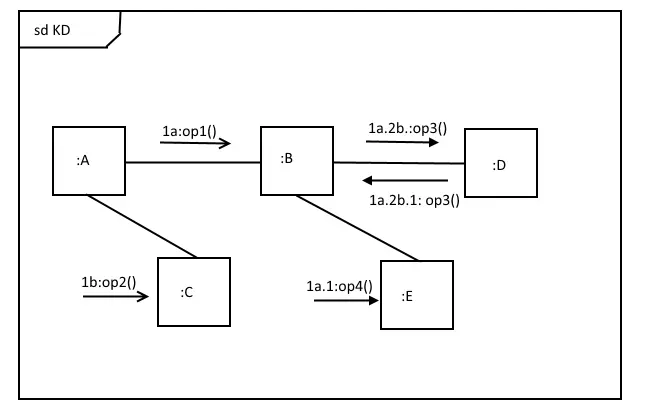
- Communication diagram: Similar to a sequence diagram, communication diagrams model a message transfer using lifelines. However, this UML diagram does not use dashed lines for time sequences, but instead numbers the sequences with digits and letters. These so-called sequence terms are located above an arrow whose tip points in the direction of the receiver. Numbers represent the order in which messages are sent, letters for the hierarchical level (as shown in the figure below).
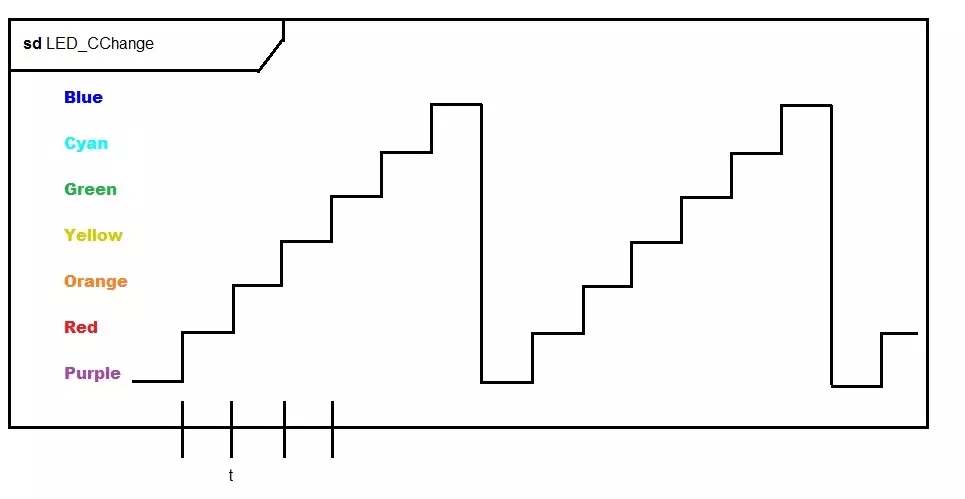
- Timing diagram: A timing diagram makes it possible to show the behavior of systems in detail under the aspect of time sequencing. Real-time systems, for example, have to complete certain processes within a certain period of time. To better represent a time plane, UML 2.0 models timing diagrams as two-dimensional diagrams, with an x-axis and a y-axis. In this sub-category of the sequence diagram, the object states are on the y-axis, and the time sequences assigned to them run along the y-axis.
- Interaction Overview Diagram: The interaction overview diagram newly added in UML 2.0 helps to display a very complex system in a rough outline when a normal interaction diagram would be too confusing. A sequence diagram is suitable for a detailed display. The UML diagram is similar to the activity diagram with nodes. It represents control flows between interactions. This is different than an activity diagram, because an entire interaction diagram can be nested within nodes that stand for activities. These nestings can be shown directly in the diagram (inline) or refer to the model (keyword: ref) which is shown in detail elsewhere.
UML diagrams: an overview
The following overview shows the categories and possible applications of the individual UML diagram types in short form. If you want to visually represent a model-oriented software system, you should first select one of the UML diagram types according to the recommendation of the UML task force. Only then is it worthwhile to choose one of the many UML tools, since these often require a certain method. Then you can then create a UML diagram.
| Category | Diagram type | Use |
|---|---|---|
| Structure diagrams | Class diagram | Represents classes |
| Structure diagrams | Object diagram | Shows a system’s state at a specific moment |
| Structure diagrams | Component diagram | Shows dependencies and structure components |
| Structure diagrams | Composite structure diagram | Divides modules or classes into their components, and clarifies their relationships |
| Structure diagrams | Package diagram | Groups classes into packages, represents package hierarchy and structure |
| Structure diagrams | Deployment diagram | Shows the distribution of components to computer nodes |
| Structure diagrams | Profile diagram | Illustrates usage relationships through stereotypes, boundary conditions, etc. |
| Behavior diagrams | Use case diagram | Represents various uses |
| Behavior diagrams | Activity diagram | Describes the behavior of different (parallel) processes in a system |
| Behavior diagrams | State machine diagram | Documents how an object is changed from one state to another through an event |
| Behavior diagrams - interaction diagrams | Sequence diagram | Represents the timing of interactions between objects |
| Behavior diagrams - interaction diagrams | Communication diagram | Shows the role distribution of objects within an interaction |
| Behavior diagrams - interaction diagrams | Timing diagram | Demonstrates the temporal limitation for events that lead to a change of state |
| Behavior diagrams - interaction diagrams | Interaction overview diagram | Shows how sequences and activities interact |
The Object Modeling Group issues UML certificates. If you would like to further your knowledge, find out more about UML tutorials.


